item-2
Image: International Energy Agency (CC BY 4.0)
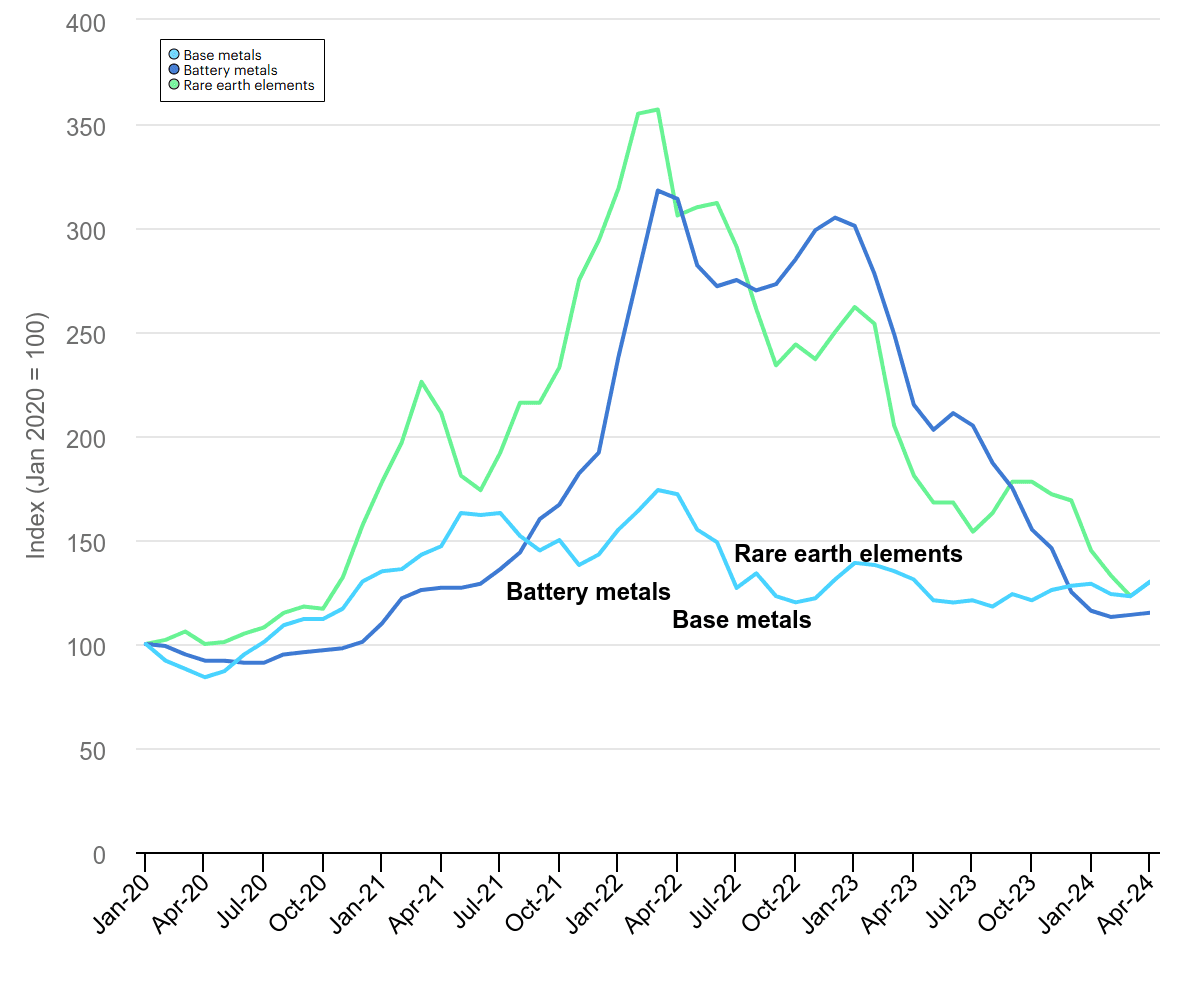
Description
The provided image is a line graph illustrating the price developments of 'Base metals', 'Battery metals', and 'Rare earth elements' indexed to January 2020 = 100, from January 2020 to April 2024.
Geological Context
This image does not depict a mineral or rock, but rather economic data related to various metal categories, which are extracted from geological sources. The graph shows market trends rather than geological formation or context.


